
A Parked Truck Costs $1,000 a Day. Here's the Math.
ATRI data shows a parked truck costs ~$1,000/day in hard costs and lost revenue. See the full breakdown and how cutting driver time-to-fill recovers it.
Read articleIn August 2026 we handed our screening tool to an outside auditor and asked him to try to find bias in it. He ran 6,030 resumes through it. The gap between the best- and worst-scoring demographic group came back at 2.4%.
The audit was conducted by Prof. Vladimir Hedrih under the methodology required by New York City Local Law 144, the rule that governs automated employment decision tools. He is not an employee, holds no stake in the company, did not help build the tool, and his fee was not contingent on the outcome.
The design matters more than the headline number, so it is worth being precise about it.
The auditor started with real applications submitted to real jobs on our platform. Those resumes were stripped of personal data and reformatted into a standard template. Then each one was reissued as a set of variants: the same work history, the same skills, the same education, but a different name and different demographic information attached. Every combination of race and sex, plus a control version with no demographic data at all.
402 base resumes, 15 variants each. 6,030 evaluations in total. The only thing that changed between variants was identity.
If you audit a screening tool on real applicant data, any scoring gap you find is a mix of two things: bias in the model, and genuine differences between the people who applied. You cannot separate them. Holding the resume constant and changing only the name removes that ambiguity. Whatever gap remains came from the model.
Across all 14 demographic groups, scoring rates landed between 49.5% and 50.7%. In the language the law uses, the lowest impact ratio on the final score was 0.976. Regulators treat anything below 0.80 as evidence of adverse impact, so 0.976 clears that line comfortably.
Stated plainly: change the name and demographics on a resume, and the score moves by about two and a half percent.
A number on its own is hard to judge, so here is the context.
In 2004, Marianne Bertrand and Sendhil Mullainathan published a field experiment that ran the same test on human recruiters. They sent nearly 5,000 identical resumes to real employers, varying only the name. Applicants with white-sounding names received callbacks at roughly 10%. Applicants with Black-sounding names received callbacks at roughly 6.7%. That is a 33% gap, or an impact ratio of 0.67.
Same experiment, same logic, two decades apart. Our gap is about 13 times smaller.
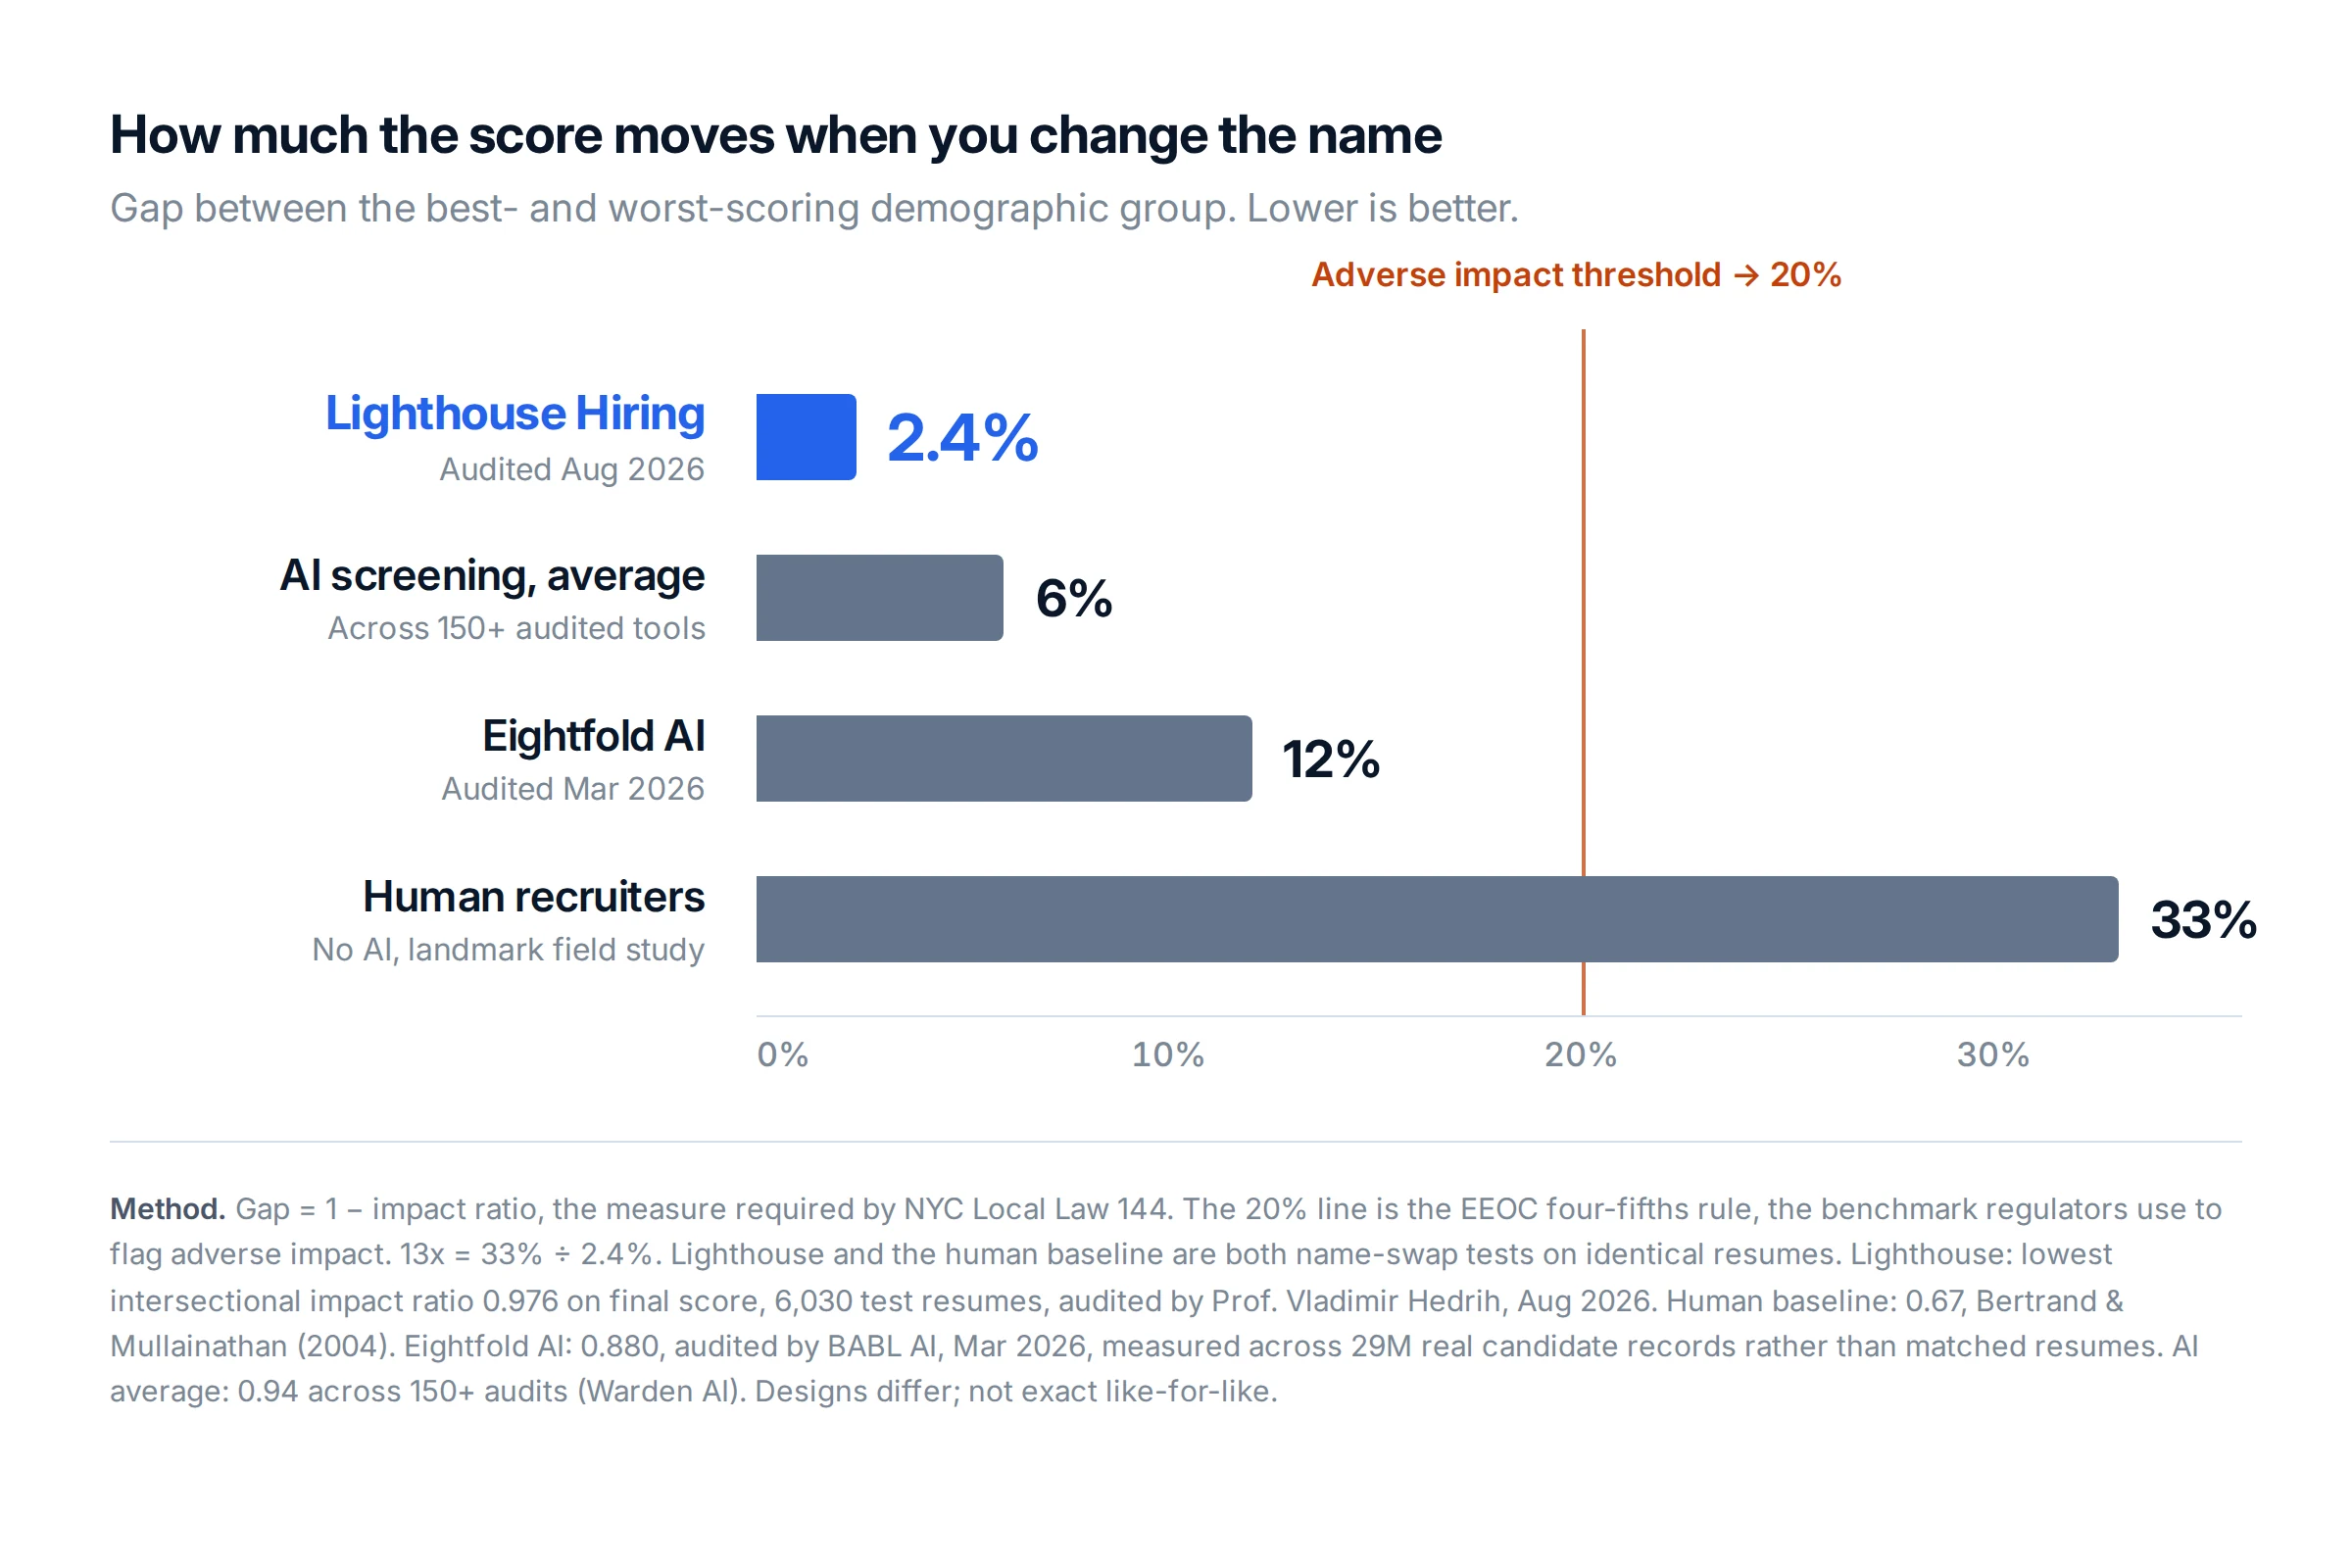
The chart also includes two reference points from the wider industry. Across more than 150 published bias audits of AI hiring tools, the average impact ratio is 0.94. Eightfold AI, one of the larger vendors in this category, published an audit in March 2026 with a lowest impact ratio of 0.880.
Eightfold's audit measured 29 million real candidate records, not matched resumes. That means their number includes genuine differences between actual applicant pools, and it is not measuring the same quantity ours is. We are not claiming a multiple against them, and you should be skeptical of any vendor who does. The comparison that holds up is the one against the 2004 study, because it used the same experimental design.
Published audits are easy to wave around and harder to read carefully. Here is what ours does not establish.
The lowest number anywhere in the report is 0.956, on the attributes component score, where 91.5% of candidates receive an identical value. We are pointing at it rather than waiting for someone to find it.
Screening software is not automatically fairer than a person. Some audited tools score worse than the human baseline. The Workday lawsuit is a reminder of what happens when nobody checks.
What software does offer is the ability to be measured. You can hand a model 6,030 controlled resumes and observe exactly what it does. You cannot run that experiment on a hiring manager's judgment at any useful scale.
So we ran it, and we published the result along with its limitations. If you want to check our work, the full audit report is here.
| Measure | Result |
|---|---|
| Resumes evaluated | 6,030 (402 base × 15 variants) |
| Scoring rate range, all groups | 49.5% – 50.7% |
| Lowest impact ratio, final score | 0.976 |
| Lowest impact ratio, any component | 0.956 (attributes score) |
| Adverse impact threshold | 0.80 (EEOC four-fifths rule) |
| Deidentification control check | 0.985 correlation with source resumes |
| Auditor | Prof. Vladimir Hedrih, independent |
| Framework | NYC Local Law 144, 6 RCNY § 5-301 |
Modernize your hiring with Lighthouse — screen faster, fairer, and more accurately.